Climate transition and portfolio decarbonation: what's at stake?
CPRAM has developed a climate capability over the past five years. It manages now about €3.5 bn in climate transition strategies in all asset classes, including € 3 bn in open-ended funds and €500m in dedicated funds. Below, we present our methodology and our research on portfolio’s decarbonation.
Published on 11 December 2023
How do you select climate-transition companies?
There are several methodologies and metrics for analysing transition issues, i.e., the alignment of companies and portfolios with scenarios for decarbonating the economy. At CPRAM, we choose to combine our portfolios’ decarbonation trajectory, which is on a 1.5°C scenario, with the use of data from CDP1 and the Science Based Target initiative (SBT)2.This aimsto select companies having the best environmental performances and that are the most committed to the climate transition.
The CDP database offers very good coverage of all asset classes and currently covers more than 18,000 companies. The CDP’s research encompasses all climate performance factors, such as reduction of greenhouse gas emissions, environmental reports, global transition plans, etc. Each year, the CDP sends a questionnaire to the largest and the most heavily polluting companies to assess their practices. This questionnaire, which consists in 150 questions in various modules and specific features for each sector, leads to a detailed analysis of each company and a scoring on which we base our selection of stocks.
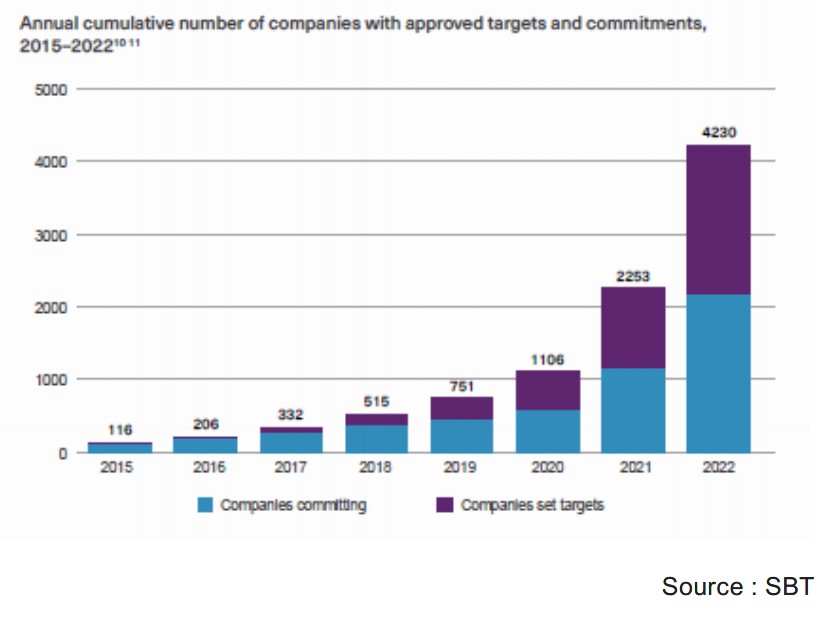
We also refers to the SBT initiative. It has developed a methodology to guide companies in setting objectives for reducing their emissions that are compatible with scientific scenarios and approves these objectives or targets. SBT is the only methodological standard that is now being widely and rapidly adopted. Today, companies that have made SBT commitments account for about one third of total market cap and one half of European market cap, as well as half of the market cap of high-impact sectors, which have committed to SBT. That is highly encouraging. SBT is now working on a mechanism to monitor the trajectory of engaged companieson a regular basis, called MRV (Measurement, Reporting and Verification), which will be implemented in 2024.
In addition, we exclude companies that still exploit fossil fuels, those that have the worst ESG practices, based on either their overall score or on environmental sub-criteria, and those that are subject to controversies. The goal is to refrain from investing in companies that could harm the environment
Other than stock-picking, what transition metrics do you apply in constructing your portfolios and why?
Yes, for portfolio construction, we ensure that we invest significantly in high-impact sectors, such as agriculture, energy, construction and transports, which are key to decarbonising the economy.
Lastly, it is worth pointing out that the decarbonation trajectory applied to the portfolio makes more sense when combined at all of these stages. Indeed, a portfolio that shows a decarbonation trajectory without excluding fossil fuels more easily offsets very high carbon intensities with far lower carbon intensities, while continuing to finance very poor practices and in ultimately having a negative impact on the environment. Meanwhile, if the portfolio has a decarbonation trajectory but is not invested in highimpact sectors, it does not accompany the decarbonation of the economy. And, lastly, for portfolio decarbonation to reflect decarbonation of the economy, it must result mainly from selected companies and not from portfolio turnover, as the manager could simply shift gradually to companies having lower and lower carbon intensities. That’s why the selection based on CDP scores and SBT commitments matters. The more we select companies committed to reducing their emissions, the more we maximise the chances of having good candidates for decarbonation and hence a real environmental impact.
That’s why we believe it is important to break down the various effects of the decarbonation trajectory to properly identify those that come from efforts that companies actually make and those that come from portfolio turnover. We have constructed a decarbonation-attribution model that may apply to carbon intensity or any extra-financial indicator, as long as we have the data granularity needed to do so.
How do you identify companies’ actual contribution to decarbonising the portfolio?
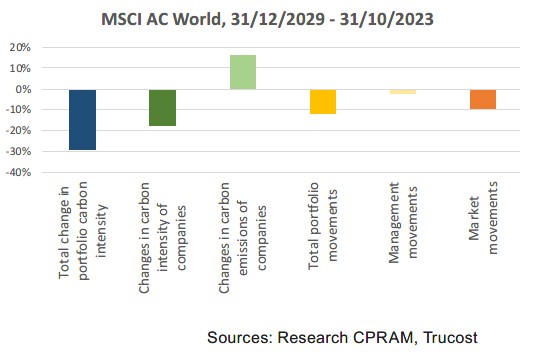
The diagram to the right explains our methodology and the various effects that we have been able to identify:
- In the change of carbon intensity from invested companies (in green in the chart to the right), it is important to consider the contribution from carbon emissions in absolute terms. If companies’ decarbonation is driven by an increase in their revenues while emissions continue to rise, it means that we will have failed to meet the carbon budgets provided by scientists.
- In the change in carbon intensity from portfolio turnover (in yellow on the chart), it is worth distinguishing the effects from portfolio turnover and weightings of securities within the allocation that might be linked to turnover or market effects.
Could you give us a more concrete example?
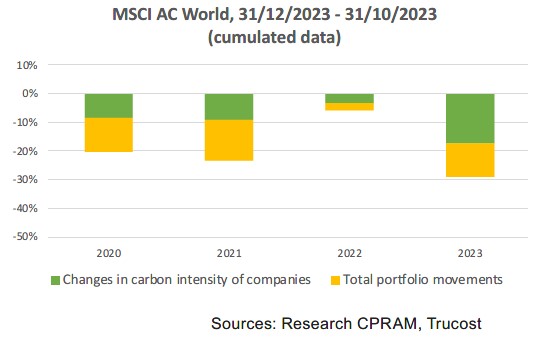
Let’s look at the two charts below. Based on the change in carbon intensity of the MSCI AC World Index3 (which has about 3000 stocks) from January 2020 to November 2023, we estimate a reduction in carbon intensity of about 30% during the period. At first sight, it seems good. But when we observe more closely at the breakdown in the second chart, things look a little less rosy. In fact, companies have raised their emissions during the period. The decline in intensities was driven rather by the increase in their revenues and the market performance effect,. Companies, offering a low overall carbon intensity the their index, have performed very well. These include the so-called “The Magnificent Seven”.
We can also observe the efforts made by each sector to identify those that have contributed the most to the increase in carbon emissions during the period. These are materials, energy and technological tools. They all were hit hard by Covid 19 and have rebounded strongly thereafter, which explains the steep rise in their emissionsThese analyses should be expanded to longer periods, as they cover a very special period during which carbon emissions fell sharply because of the Covid 19 pandemic and then rebounded sharply when the economy opened back up. This showed up in 2022 and 2023 because of the gap in reporting emissions. Moreover – and this seems obvious – the more reliable company-reported data is, the more relevant analyses will be. In particular, changes in methodology or perimeter on Scope 3 could impact the results. We are also counting on the CSRD regulation to enhance data quality.
The study was illustrated here on an index, but it is also relevant to all actively managed climate portfolios. This analysis provides a precious tool for our managers, as help them understanding more clearly the decarbonation of their portfolios. They can also measure the importance of selecting the most committed companies, so that decarbonation will come from companies in which they have invested in to reflect the decarbonation of the economy.
2. Science-based Target initiative: a partnership between CDP, the United Nations Global Company, the World Resources Institute and the Worldwide Fund for Nature.
3. We use Trucost data for carbon intensities, Scopes 1, 2 and 3 upstream