Markets and strategies
Gold mining in a strategic allocation
Physical gold is a classic investment medium for households, central banks in developed and emerging countries and institutional investors. It is recognized for its qualities as a safe investment. However, gold can also be a part of a strategic allocation because of its performance over the long term, as well as its diversification characteristics compared to fixed income and equity asset classes. Finally, we believe that gold mining stocks represent a suitable investment vehicle for exposure to gold. Provided that certain conditions are met.
Published on 18 February 2026

Key points on the main strategic characteristics of gold
On August 15, 1971, the President of the United States announced the end of the convertibility of the dollar into gold: an ounce of gold was then worth $35. At the end of January 2026, an ounce of gold had just crossed $5,000! This represents an annualized performance of more than 9.5% for an American who had the idea of investing in 1971. A similar performance can be observed in the other major currencies, and over other periods.
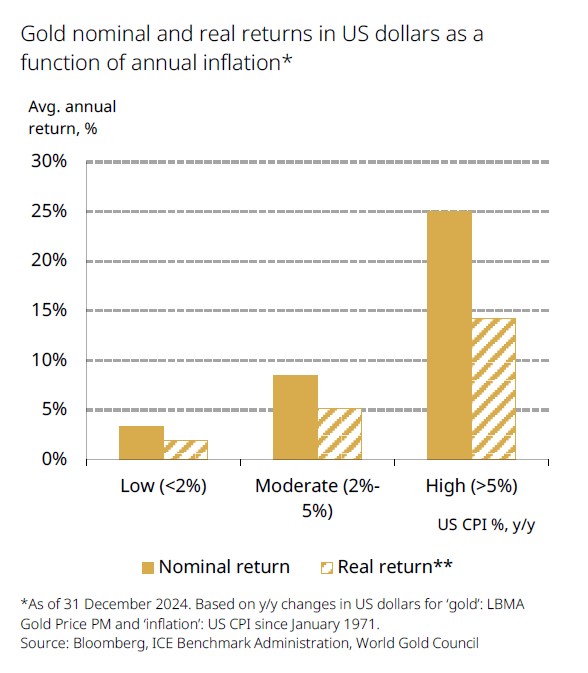
The World Gold Council (WGC) tends to demonstrate the interest of investing in gold when investors want to hedge against inflation risk : since 1971, the price of the metal has risen faster than the US and world consumer price indices (CPI). In years when inflation was between 2% and 5%, the price of gold rose by 8% per year on average. The study shows that this figure has increased significantly with even higher levels of inflation.
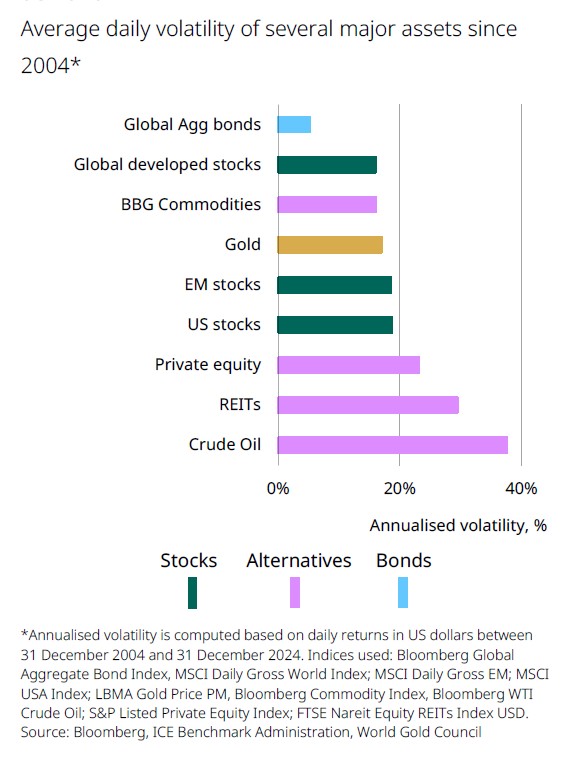
Gold has also demonstrated lower volatility than many stock indices, alternative investments and commodities. We have also estimated the volatility of the price of gold miners at around 36%1. This result is consistent with an "average leverage" or "average beta" of 2.
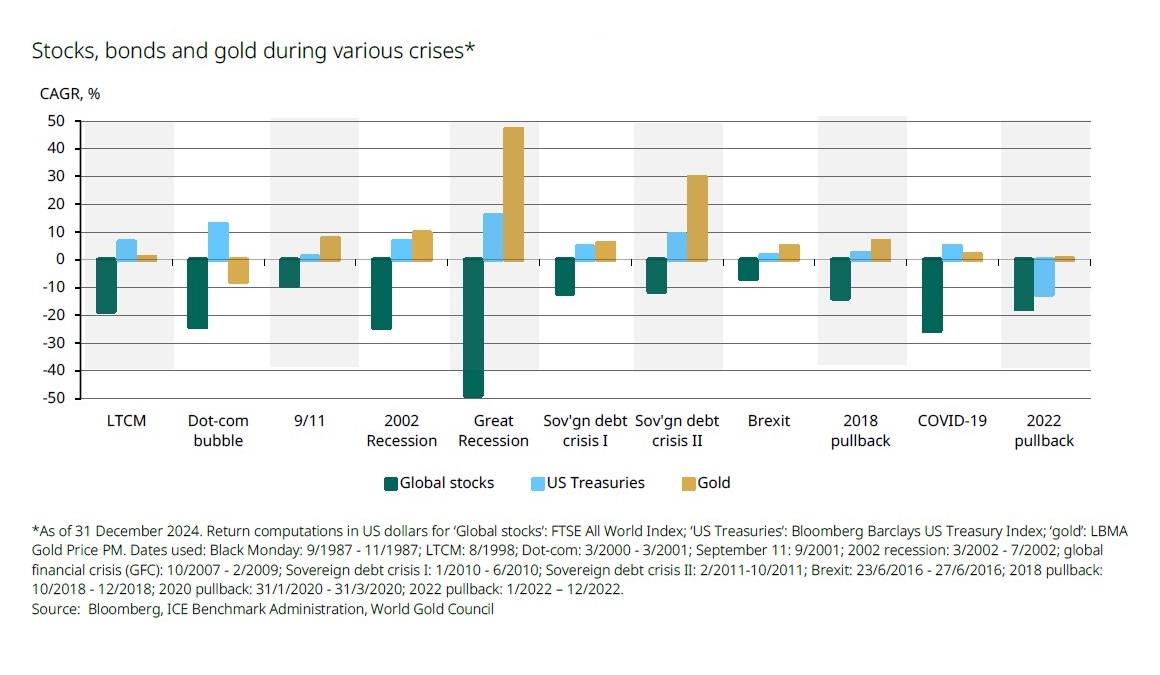
But above all, introducing gold into an allocation would make it possible to obtain favorable diversification (diversification is neither a guarantee of profits nor a protection against losses) in times of stock market crises, associated with the "flight to quality" effect.
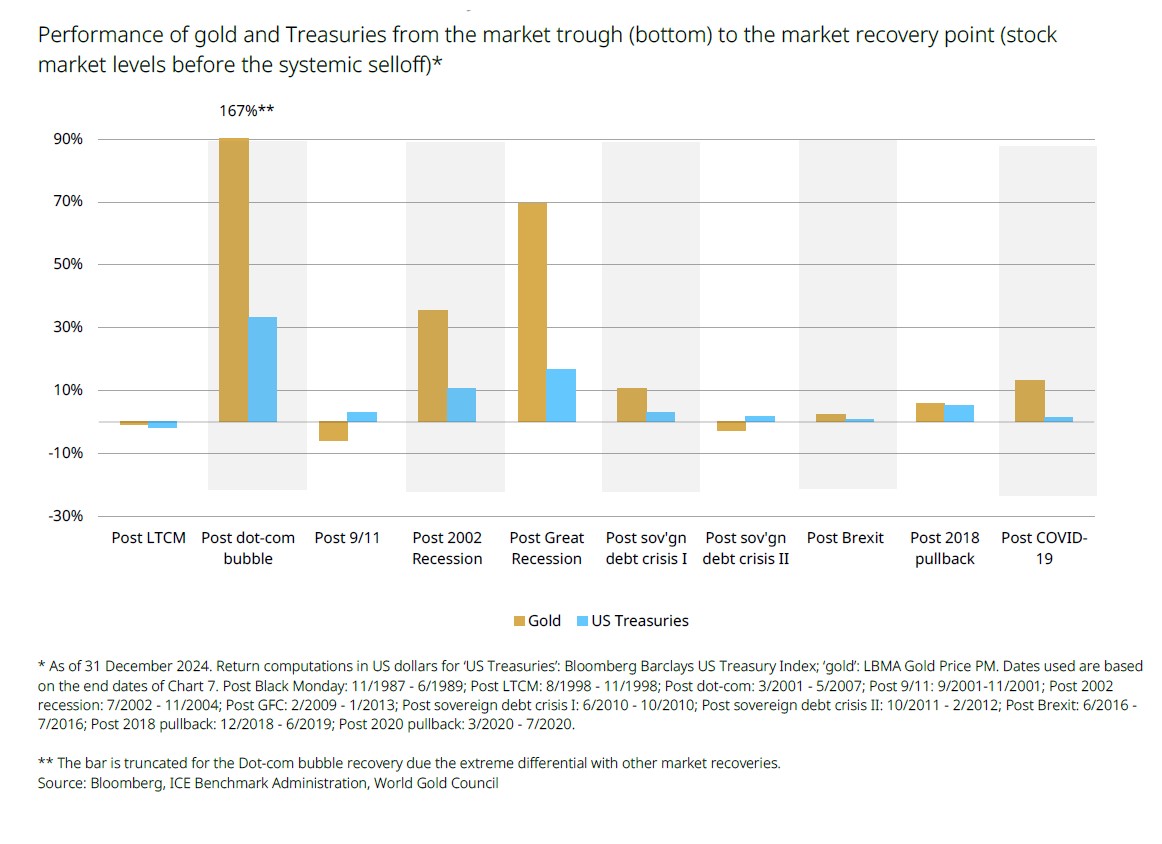
One may also note that gold has often performed better than bonds during periods of recovery right after periods of flight to quality.
Following this analysis, the WGC estimates that holding between 5% and 10% gold in a strategic allocation may improve its risk-return ratio over 20 years.
Focus on the last 20 years for a eurozone investor
Although equity markets have demonstrated robust performance over the past 20 years, gold has outperformed the main equity and fixed income indices.
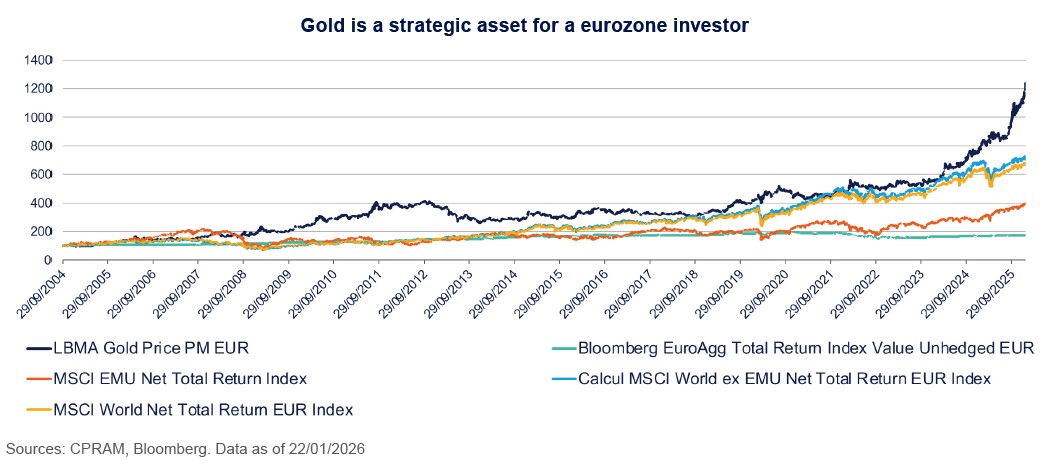
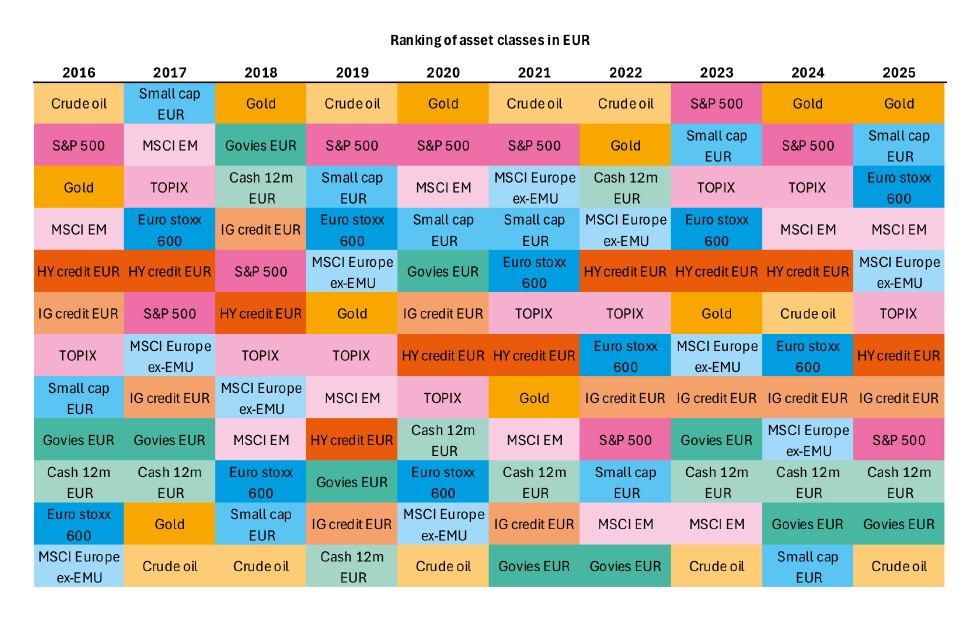
In addition, gold has shown regular performance over the last 10 years: gold is first 4 years out of 10, gold is on the podium 6 years out of 10. Gold is disappointing one year out of 102.
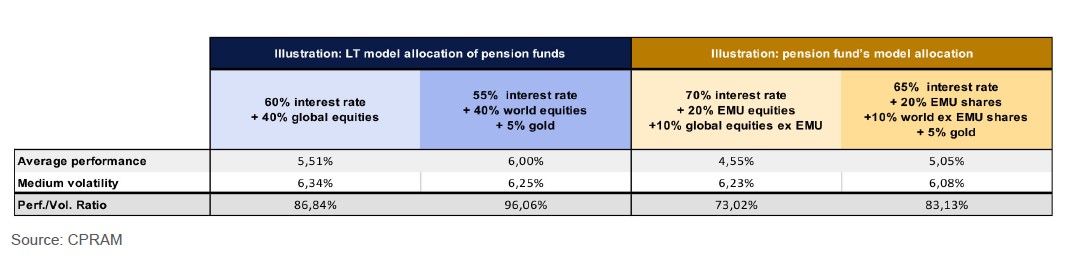
Our estimates show that it is possible to improve the returns and risks over 20 years of two classic strategic multi-asset allocations, by integrating gold.
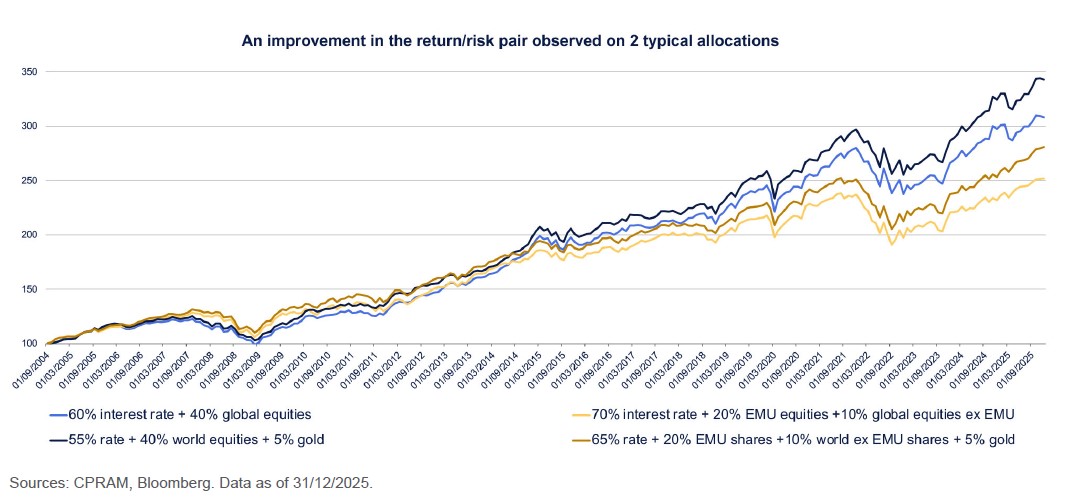
A 5% gold share in the two strategic multi-asset allocations seems to improve performance while reducing volatility over 20 years3.
How to integrate gold miners into an allocation?
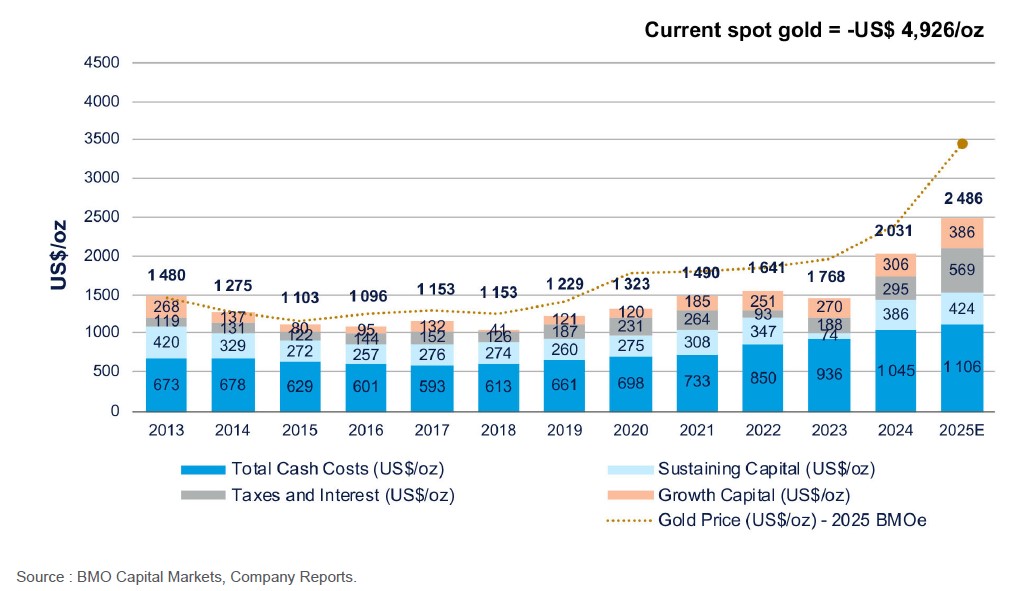
Looking at the behavior of gold mine stocks, when the price of gold is above the total costs of production. Indeed, according to our analysis, gold mining stocks would behave like call options whose underlying is the price of gold, with a strike price equal to the cost of production. This is currently the case with a price per ounce above $5000 and an estimated cost of around $2500.
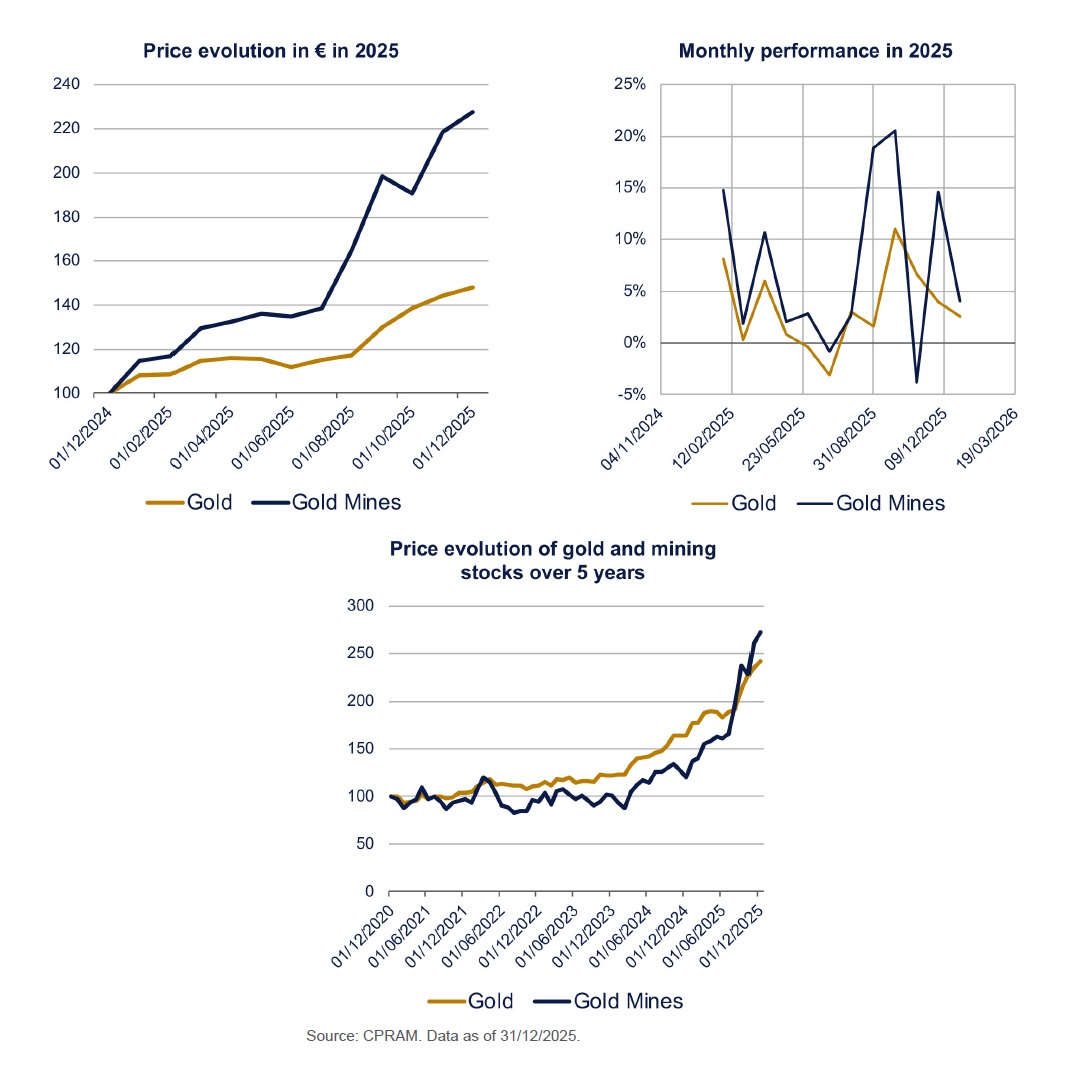
Historically, we have seen monthly outperformance of gold mines relative to gold performance.
This leverage would allow the investor to commit less liquidity than for direct exposure. This is highlighted by the evolution of prices in 2025 for an investor in the euro zone but also the evolution of monthly returns4.
There is indeed a leverage effect as for a call for gold mines, but this leverage of about 2 on average varies over time.
Gold miners can be used to substitute gold in a portfolio if the market price of gold is higher than its production costs. In this case, exposure to gold mines can vary between 3% and 10%.
We also note that gold mines and gold have had comparable performances over the past 5 years4.
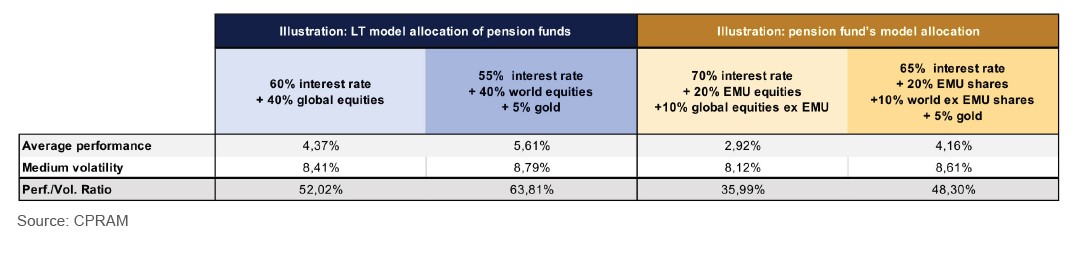
We estimate that it is also possible to improve the performance and risks of two classic fixed income allocations, equities by integrating gold mines since the price of an ounce of gold has crossed the $2000 threshold5.
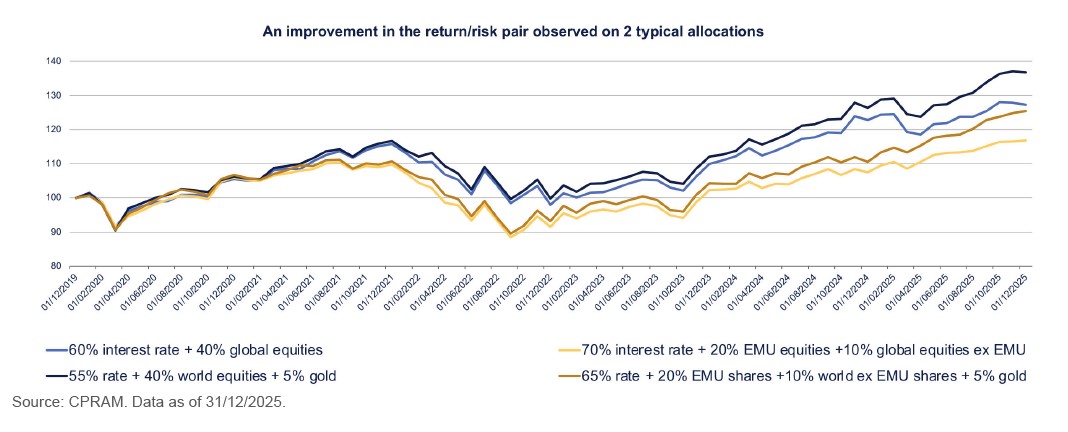
The introduction of 5% gold mines in the two traditional model allocations has improved performance and performancevolatility ratios since gold crossed the $2000 threshold5.
The substitution is made possible by the size of the gold mining market.
In our view, gold is a strategic asset and not just a safe haven. Its introduction at the heart of an allocation might be favorable to the investor, as the WGC tends to prove in its study. It is possible to gain exposure to the price of gold with traditional media (coins, bars, etc.), but their access, management, custody and security remain the responsibility of the investor.
Gold mining equity funds seem to offer an alternative to overcome these constraints, for investors wishing to gain exposure to the price of gold. These funds seem to have a leverage effect, which is all the more important when the price of gold exceeds its cost of production.
[1] Indices utilisés : Or : LBMA Gold Price PM EUR. Sur la même période, les Mines d’or affichent une volatilité de 36% sur 20 ans (Indice : NYSE Arca Gold miners NTR). Données analysées du 31/12/2004 au 31/12/2025.
[2] Indices utilisés : Curde Oil : S&P GSCI Crude oil ; HY Credit EUR : iBoxx EUR High Yield Developed Markets ; IG credit EUR : S&P IG CORPORATE BOND INDEX ; Smallcap EUR : MSCI EMU SMALL CAP ; Govies EUR : EMU TOTAL ALL LIVES DS GOVT. INDEX ; Cash 12m : JPM CASH EUROPE 12M INDEX. Données au 31/12/2025.
[3] Indices utilisés : Prix de l’once d’or en euros : LBMA Gold Price PM EUR ; Taux : Indice Bloomberg EuroAgg Total Return Index Value Unhedged EUR ; Actions emu : Indice MSCI EMU Net Total Return Index ; Actions monde ex emu : Indice MSCI World ex EMU Net Total Return EUR Index ; Actions monde : Indice MSCI World Net Total Return EUR Index. Données au 31/12/2025.
[4] Indices utilisés : Or: LBMA Gold Price PM EUR ; Mines d’or : NYSE Arca Gold miners NTR.
[5] Indices utilisés : Mines d’or : Indice des mines d’or NYSE Arca Gold Miners NTR en euros ; Taux : Indice Bloomberg EuroAgg Total Return Index Value Unhedged EUR ; Actions emu : Indice MSCI EMU Net Total Return Index ; Actions monde ex emu : Indice MSCI World ex EMU Net Total Return EUR Index ; Actions monde : Indice MSCI World Net Total Return EUR Index. Données au 31/12/2025.
Investing involves risks, including the risk of capital loss. Past performance is not a guarantee or an indicator of future performance. This communication is not contractual in nature but constitutes advertising communication. It is provided for informational purposes only and does not constitute a recommendation, analysis, or financial advice. Furthermore, it should not be considered as a solicitation, invitation, or offer to buy or sell collective investment schemes (CIS). Before subscribing to a collective investment scheme (CIS), the potential investor is advised to consult their advisor so that the latter can ensure the suitability of the intended investment with their financial and patrimonial situation.
This document is based on sources that CPRAM considers reliable at the time of publication. Data, opinions, and analyses may be changed without notice. CPRAM disclaims any direct or indirect liability that may result from the use of the information contained in this document. CPRAM cannot be held responsible under any circumstances for any decision or investment made based on the information contained in this document. The information contained herein may not be copied, reproduced, modified, translated, or distributed without the prior written permission of CPRAM. All trademarks and logos used for illustration purposes in this document are the property of their respective owners. This publication may not be reproduced, in whole or in part, or communicated to third parties without the prior authorization of CPRAM.
This publication is not intended for US persons as defined in the US Securities Act of 1933. MSCI information is exclusively intended for your internal use, may not be reproduced or redistributed in any form, and may not be used as a basis or component of any financial instrument, product, or index.
None of the MSCI information is intended to constitute investment advice or a recommendation to take (or refrain from taking) any investment decision and may not be relied upon as such. Historical data and analyses should not be considered as an indication or guarantee of any analysis, forecast, or prediction of future performance. MSCI information is provided "as is," and the use of this information implies assuming full risk related to any use of this information. MSCI, each of its affiliated companies, and other persons involved in compiling, calculating, or creating any MSCI information (collectively referred to as the "MSCI Parties"), or in connection with these activities, expressly disclaim any warranties (including, without limitation, any warranties of originality, accuracy, completeness, timeliness, non-infringement, merchantability, and fitness for a particular purpose) regarding this information. Without limiting the foregoing, under no circumstances shall any MSCI Party be liable for any direct, indirect, special, incidental, punitive, consequential damages (including, without limitation, loss of profits), or any other damages. (www.mscibarra.com).
All rights reserved. The information contained in this document belongs to Bloomberg and/or its content providers, may not be reproduced or redistributed, and offers no guarantee as to its accuracy, completeness, or relevance. Neither Bloomberg nor its content providers can be held responsible for any damages or losses resulting from the use of this information. There is no guarantee that professionals currently employed by CPRAM will continue to be employed, nor that the past performance or successes of any of them will serve as an indicator of their future performance or successes. For illustration purposes only.
CPR Asset Management, portfolio management company, authorized by the AMF under number GP 01-056 dated December 21, 2001 (Autorité des Marchés Financiers, 17, place de la Bourse, 75082 Paris), a public limited company with a capital of 61,461,945 euros, registered under number 399 392 141 RCS.
91-93, boulevard Pasteur, 75730 Paris - Cedex 15. Tel: 01 53 15 70 00